


This lesson focuses on improving your IELTS writing task 1 introduction for the academic paper. To write an introduction you must paraphrase and re-write the information given by IELTS about the chart of graph.
Below is a sample line graph sent to me by an IELTS Candidate.
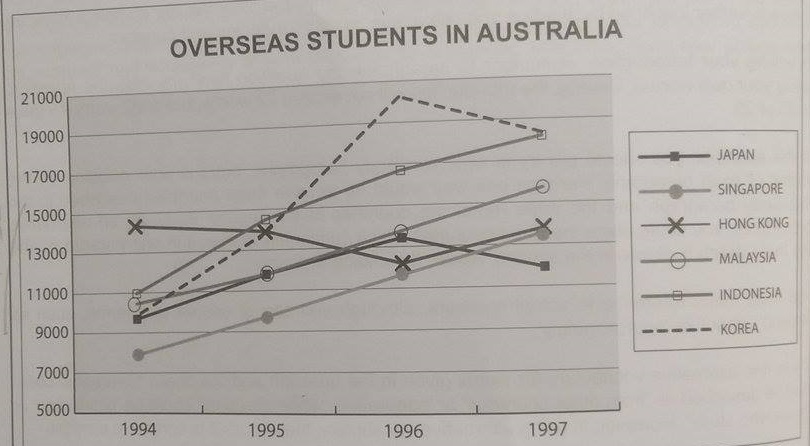
The line graph below shows the number of overseas students who came from six Asian countries to study in Australia from 1994 to 1997.
Source: Graph above was not created by IELTS Liz.
Introduction Paragraphs for Writing Task 1
Below are two introductions written by the IELTS candidate. Would you use one of these introductions or would you write a different introduction?
Introduction 1: The diagram shows the amount of students from six different countries in Asia, who came to study in Australia between 1994 and 1997.
Introduction 2: Between 1994 and 1997 the number of Asian students from six different countries, who came to study in Australia.
Questions:
- Do they cover all the necessary information?
- Are there any errors in them?
- How you would write your introduction to the line graph above?
- How many paragraphs would you have for your complete report for the above line graph?
Feel free to post your answers. However, please note I do not common on writing.
Answers and Model Introduction
Click below to reveal the answers and model introduction paragraph.
Answers & Model Introduction
- They both cover most of the important information. However, they are lacking the list of countries. Where possible include the list, unless it is too long.
- Errors:
- A line graph is a line graph. Those words should not be paraphrased.
- Always try to paraphrase the verb “shows”.
- The word “amount” is for uncountable nouns, not for countable nouns. We can use this word with “people” or “students”. See this page: Uncountable Nouns
- See the model answer below:
- The line graph illustrates how many students from six different countries in Asia (Japan, Singapore, Hong Kong, Malaysia, Indonesia and Korea) went to Australia to study in 1994, 1995, 1996 and1997.
- How would you organise your task 1 writing for the above line graph? How many paragraphs would you have? What information would you put in the body paragraphs?
You should have 4 paragraphs: introduction, overview, body paragraph A and body paragraph B.
In body paragraph A, you can put information about Singapore, Malaysia, Indonesia and Korea. In body paragraph B, you can put information about Japan and Hong Kong because they showed different trends from the others.


.png)


