


Creating a Model Answer for IELTS writing task 1.
Many students asked me to write a full model answer for this bar chart which was used in my lessons last week.
IELTS Complex Bar Chart
Source of Bar Chart: https://www.english-in-chester.co.uk
IELTS Bar Chart Model: Sentence Ordering
Put the 10 sentences below in order to make a full band 9 model answer for IELTS writing task 1.
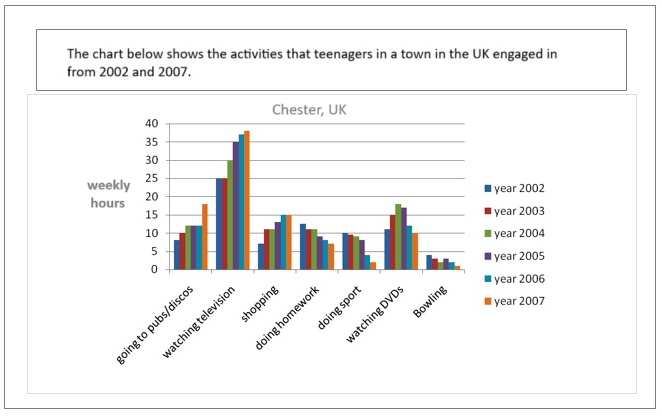
- A) Teenagers spent 25 hours on watching television in 2002 which increased to almost 40 hours in the final year.
- B) The other pursuits showed a decrease in hours, except watching DVDs which fluctuated.
- C) Going to pubs or discos, watching TV, and shopping all showed an increase in the number of hours teenagers spent on these activities.
- D) The bar chart illustrates how many hours adolescents in Chester spent on seven activities each week between 2002 and 2007.
- E) While teenagers occupied 10 hours doing homework in 2002, this figure dropped to just over 5 in 2007.
- F) The number of hours teenagers dedicated to watching DVDs was only 10 hours in first and final years, but reached a peak of over 15 hours in 2004 and 2005.
- G) Overall, the most popular activity over the period given was watching TV, whereas bowling was the least favourite.
- H) Bowling was under 5 hours throughout the entire period (declining by about 4 hours in total).
- I) Both going to pubs or discos, and shopping more than doubled in hours from over 5 to around 15 or slightly above.
- J) Playing sport fell more dramatically from 10 hours to around 3 hours.
Notice how many sentences are used to create a full model answer. IELTS writing task 1 does not require many sentences. There are NO fixed number of sentences for writing task 1, but you can see that you do not need many to write a high score answer.
Answers
Answers are now available. Please remember the answers also contain the full model answer in the right order. This isn’t just a lesson to complete an exercise, it is a method of helping you understand model answers and to learn from them. Take your time to review your answers and also review the full model.
Click below for the Answers
AnswersD, G, C, B, A, I, E, J, H, F
The bar chart illustrates how many hours adolescents in Chester spent on seven activities each week between 2002 and 2007.
Overall, the most popular activity over the period given was watching TV, whereas bowling was the least favourite. Going to pubs or discos, watching TV, and shopping all showed an increase in the number of hours teenagers spent on these activities. The other pursuits showed a decrease in hours, except watching DVDs which fluctuated.
Teenagers spent 25 hours on watching television in 2002 which increased to almost 40 hours in the final year. Both going to pubs and discos, and shopping more than doubled in hours from over 5 to 15 or slightly above.
While teenagers occupied 10 hours doing homework in 2002, this figure dropped to just over 5 in 2007. Playing sport fell more dramatically from 10 hours to around 3 hours. Bowling was under 5 hours throughout the entire period declining by about 4 hours in total. The number of hours teenagers dedicated to watching DVDs was only 10 hours in first and final years, but reached a peak of over 15 hours in 2004 and 2005.
Word count = 194 (you do not need to write the word count in your test)
Paragraphing Tips
- It is possible that the last sentence about DVDs could be written as a separate paragraph.
- Always have an introduction and overview. They must be separate statements.
- Always divide your body paragraphs into two (or sometimes three) paragraphs.
- Your body paragraphs should be logical and help to highlight similarities and differences.
- Learn an empty line between paragraphs to make them clear and easy to see. This is not a requirements, it is a recommendation. If your paragraphs are not easy to see, your score might be lower.


.png)


