


IELTS bar chart model answer for writing task 1. This IELTS bar chart appeared in two different years in the IELTS writing task 1 test and will likely appear again. The model answer below will help you understand how to organise your ideas and support your statements with data. Also check the 10 useful tips below to help you understand the model answer better.
IELTS Bar Chart Sample Question
IELTS Model Answer for Bar Chart
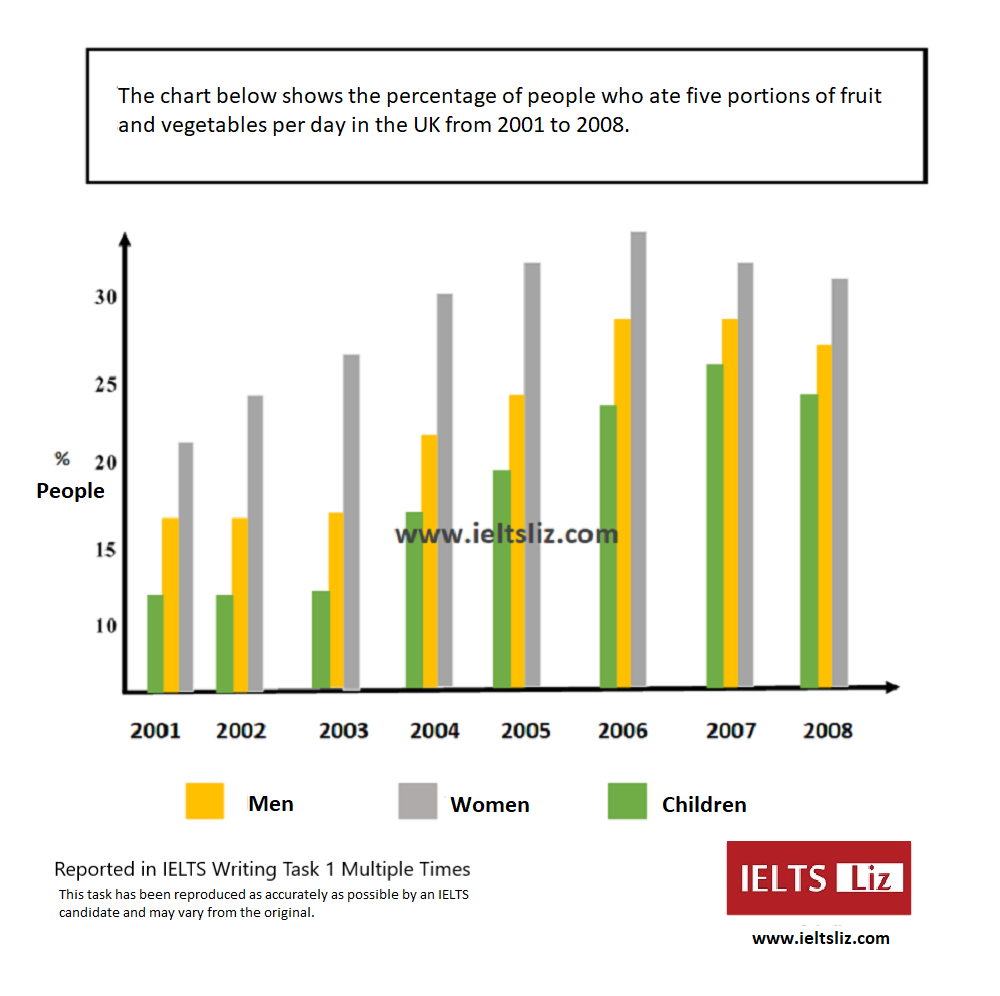
The bar chart illustrates the proportion of women, men and children consuming five servings of fruit and vegetables each day in 8 years from 2001 to 2008 in the UK.
Overall, it can be seen that the highest percentage of all people consuming fruit and vegetables was women, while children consistently accounted for the lowest proportion. Furthermore, a significant increase in the proportion of people eating these food items can be seen over the period given.
The percentage of women who ate fruit and vegetables started at just over 20% in 2001. This figure then rose steadily to reach a peak of almost 35% in 2006, before falling slightly to 30% in the final year.
In terms of men and children eating fruit and vegetables, the rate remained relatively stable in the first three years (about 17% and 12% respectively). From this point, the proportion of men climbed gradually to peak at about 27% in both 2006 and 2007, after which it dropped to about 26%. A similar growth in the figure for children was evident reaching 25% in 2007 and around 24% in the final year.
Tips for Analysing the Model Answer:
- Paraphrasing does not need to be complicated. Not all words can be changed all the time. Choose which words you will and won’t change. Trying to paraphrase too often will result in too many errors and a lower score.
- Highlight highs, lows and trends in your overview where possible.
- Make sure statements in your body paragraph are supported by data.
- Make sure paragraphs are easy to see.
- Remember this is a report, not an essay
- Look at the logical organisation of information in the model answer above. It is easy to read and not confusing. If your report is confusing to read because you jump about with information, it is a bad report. All reports should be logical and clear.
- Check the linking words used.
- Note the variation in sentence structures.
- Don’t overload your report with too many small details – be selective.
- Aim for around 170-190 words. This model answer is 184 words in length. You do not need to write your word count on your test paper.
GT Candidates: You will only have to write a letter for your writing task 1 (GT Writing )


.png)


