


Below is an IELTS table with model answer for Writing task 1. The tables below are typical of what you will get in your IELTS test. The model answers help you understand how to structure your table writing and organise data into paragraphs. Getting lost in too many numbers is the biggest challenge for IELTS tables. All model answers are estimated at band 9 and are written as a safe guide to learn from for all band scores.
How to Approach IELTS Table Questions
Useful strategies for IELTS Tables in Writing Task 1: Below are useful steps to ensure that you approach your IELTS table correctly. Try not to get lost in detail and instead look for patterns, similarities and differences to group information together.
- Analyse the key information in each category.
- look for key features (highs/lows/usual data/ changes)
- Think about grouping information and categories together
- if numbers are all below 5%, group them together as one but avoid writing them as a list and instead refer to them collectively
- group information together with similar trends is essential for an IELTS table because of the volume of data given.
- you get a lower score if you give too many small details
- you get a lower score if you miss out information
- if a number or a category is unusually high, single it out as an individual feature
- if numbers are all below 5%, group them together as one but avoid writing them as a list and instead refer to them collectively
- Plan your paragraphs and content. Each paragraph has a unique and clear function. Use the model table answers above to review them.
- Introduction
- Overview
- Body Paragraph 1
- Body Paragraph 2
- Body Paragraph 3 (not usual but possible at times)
- The introduction should be short and factual.
- For a free video lesson, click here: How to Write an Introduction for Writing Task 1
- The overview is the most important paragraph. Make sure it contains all key features for a high score.
- Divide your body into paragraphs.
- In most tables, you will have categories along the top and the side. You must decide the best way to divide categories into body paragraphs. Always choose the most logical.
- The time to give data in the body paragraph. Each statement must be supported with numbers from the table given. If you don’t give numbers, you’ll get a lower score for Task Achievement which counts for 25% of your marks.
- You don’t have to give all details. You can group details together by giving averages or ranges.
- Be selective. Don’t put too many details in your report.
- Make sure you write over 150 words but aim for less than 200.
- Try to avoid being repetitive with your sentence structures.
- Pay attention to what type of information the table gives (static figures or changes over a period of time). This will help you decide what kind of language to use.
- Do not try to paraphrase all words, all the time. This leads to vocabulary mistakes. Choose wisely which words to change and which to keep the same.
- All information and language should be accurate for a high score
IELTS Table Model Answers
IELTS Table: Question 1
As you see, this IELTS table shows change over two time periods with four categories in total.
IELTS Table Model Answer 1
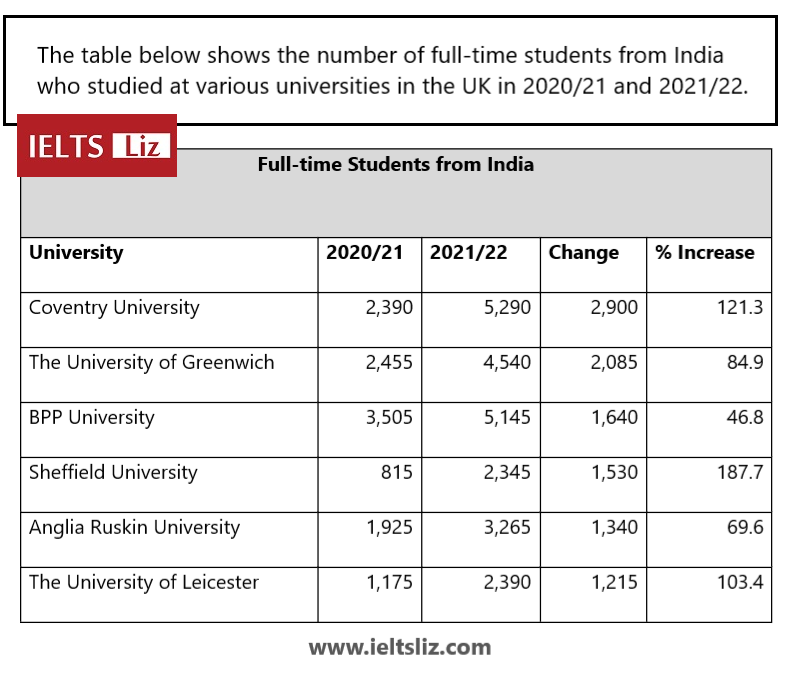
The table gives information about how many full-time students coming from India studied in six British universities in two academic years (2020/21 and 2021/22) as well as the change in numbers and percentage increase.
Overall, the greatest increase in Indian students could be seen in Sheffield University, while BBP University showed the lowest increase over the two years. The university with the most students from India was BBP University in the first year and Coventry University in the second year.
Sheffield University saw a dramatic rise of 187.7% in India students reaching 2,345 in 2021/22. Likewise, the number also climbed considerably for Coventry University by 2,900 students (121.3%) to hit 5,290 students in 2021/22. Another significant increase was seen in Leicester University from 1,175 to 2,390 students, a rise of 103.4%.
All other universities saw an increase of under 100% in the number of Indian students over from 2020/21 to 2021/22. The number of students going to University or Greenwich and Anglia Ruskin University rose by 2,085 students (84.9%) and 1,340 (69.6%) respectively. Regarding BBP University, the number of students remained high in both years at 3,505 and 5,145, which was a growth of only 46.8%.
IELTS Table: Question 2
This IELTS table is slightly easier because it contains less data. You can also see trends for each category more easily.
The table below gives information about consumer spending on different items in five different countries in 2002.
(Source: IELTS Cambridge English Test Book
IELTS Table Model Answer 2
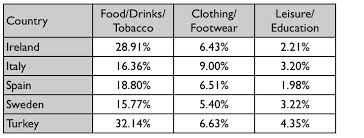
The table illustrates the proportion of consumer expenditure in Ireland, Italy, Spain, Sweden and Turkey on three types of consumer goods in 2002.
Overall, the category of consumer goods that all countries spent most on was food, drinks and tobacco, which was three times higher than on the other types of goods. The lowest spending could be seen in the category of leisure and education in all five countries. The outlay of Turkey was generally higher than the other four countries.
In terms of food, drinks and tobacco, Turkey spent the most at 32.14%. The expenditure of Ireland was also high (28.91%) compared to Sweden which spent the least (15.77%). Spain and Italy spent 18.80% and 16.36% respectively. On the other hand, the lowest expenditure was on leisure and education which accounted for under 5% in all countries. Turkey spent most on these items at just 4.35% of their national expenditure which is around double that of Spain (1.98%).
Clothing and footwear was the third category of consumer goods and outlays for those items were between 9% in Italy and 5.40% in Sweden. The national spending in this area for the remaining countries averaged around 6.5%.
Note: in most writing task 1 reports, body paragraphs do not need to be a similar length. In report writing, it is common to very some long paragraphs and others quite short. Tables are no different to other task 1 charts.


.png)


